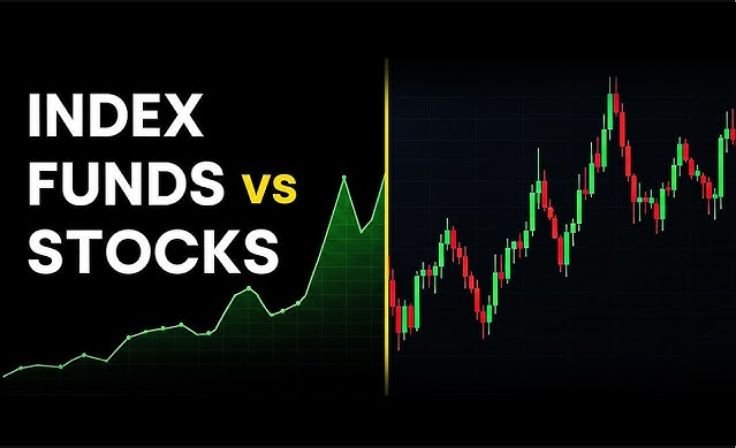


If you open any professional trading app today, you’ll see a sea of red and green bars with thin lines poking out of the top and bottom. These are Japanese Candlesticks. They were originally designed by rice traders in the 1700s to predict market moves, and today, they are the gold standard for anyone who wants to take a “leap” into serious investing.
1. The Body: Who is Winning the War?
The “Body” is the thick part of the candle. It represents the distance between the price when the market opened and the price when it closed for that specific time period (e.g., 1 hour, 1 day, or 1 week).
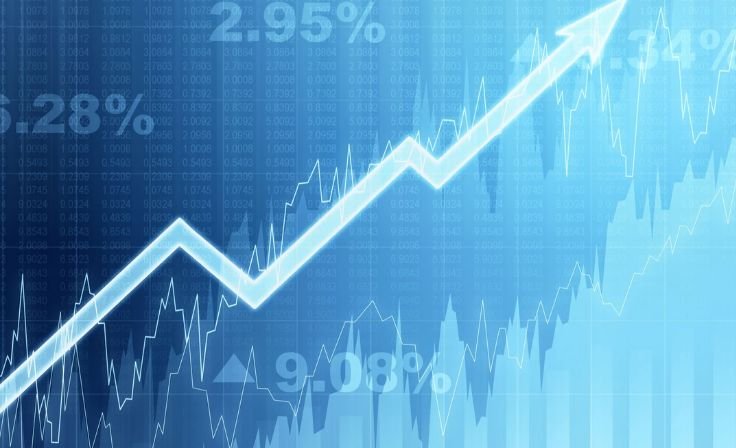
- Green (or White) Bodies: These mean the “Bulls” (buyers) are in control. The price closed higher than it opened. If you see a series of large green bodies, it’s a sign of strong buying momentum.
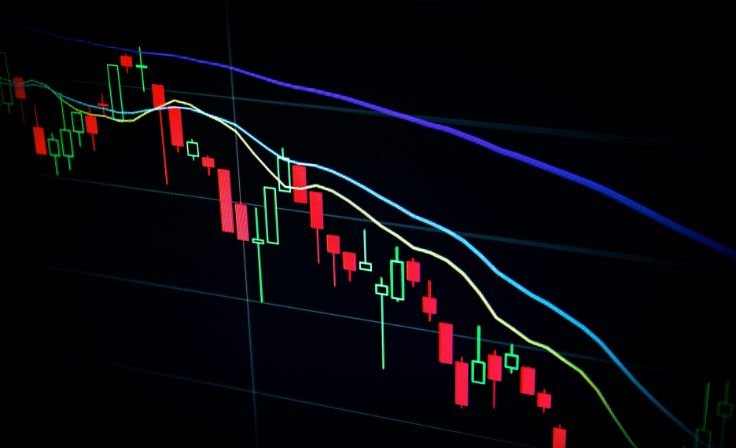
- Red (or Black) Bodies: These mean the “Bears” (sellers) are winning. The price dropped during that period. Large red bodies indicate that people are rushing for the exits.
2. The Wicks: The Story of Rejection
The thin lines poking out of the body are called Wicks (or shadows). These are the most important part of the candle for a beginner to understand. They represent the “extremes”—the highest and lowest prices reached before the market settled.
- The Long Upper Wick: This is a warning sign. It shows that the price tried to go higher, but sellers stepped in and pushed it back down. This is called “Price Rejection.” If you see this at the top of a trend, the “greed” is starting to fade.
- The Long Lower Wick: This is an opportunity sign. It shows that the price dipped, but buyers jumped in to “buy the dip,” pushing the price back up. This often signals that a bottom is forming.
3. The “Weekly” Habit: Killing the Daily Noise
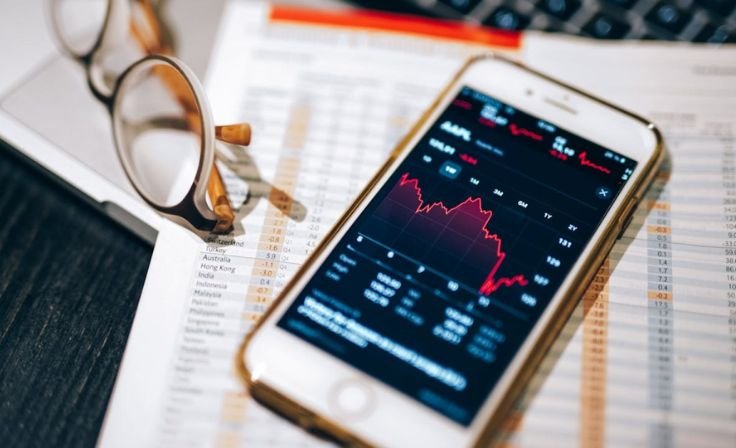
One of the biggest traps for Gen Z investors in 2026 is the “1-Minute Chart.” Watching the price flicker every second is a recipe for anxiety and bad decisions.
The Lucky Frog Secret: Switch your view to the Weekly Chart.
- The Noise: Daily charts are filled with “noise”—random news spikes, social media tweets, and AI-bot liquidations that don’t matter in the long run.
- The Trend: The Weekly Chart shows you the Truth. It smooths out the madness and shows you where the “Big Money” (banks and institutions) is actually moving. If the weekly trend is up, don’t let a “red Tuesday” scare you out of your position.
The Lucky Frog “Chart Reader” Checklist
Before you make a move on your phone, ask these three questions:
- What color is the current candle? (Is the immediate momentum up or down?)
- Are there long wicks? (Is the market rejecting high prices or low prices?)
- What does the Weekly Trend say? (Am I fighting the big current, or swimming with it?)
Final Thought: Emotions Leave a Paper Trail
The stock market is essentially millions of people making decisions based on hope and fear. Candlesticks are the “footprints” those emotions leave behind. By learning to read these prints, you stop guessing and start anticipating.
Don’t just look at the price. Read the sentiment.