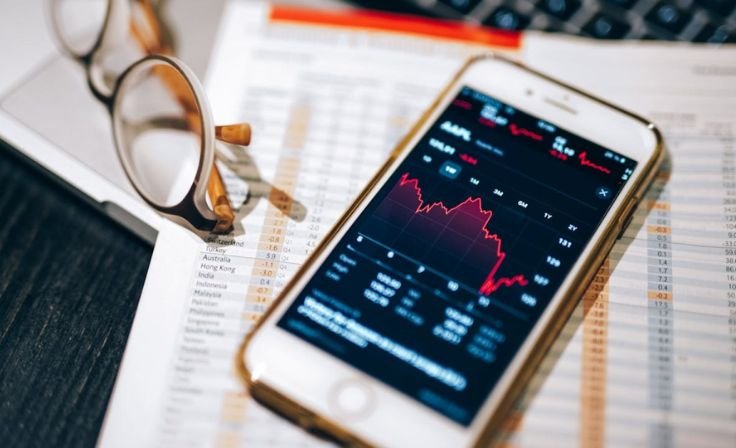


When you open a trading app today, you are hit with a wall of numbers. For the untrained eye, it looks like a foreign language. But for the informed investor, these metrics tell a story of a company’s health, its price, and its future potential.
1. The P/E Ratio: Are You Overpaying for the Hype?
The Price-to-Earnings (P/E) Ratio is the most common way to see if a stock is “cheap” or “expensive.” It tells you how much investors are willing to pay for every $1 of the company’s profit.
- The Formula: Stock Price ÷ Earnings Per Share (EPS).
- The 2026 Context: In a market dominated by AI and tech, P/E ratios can be sky-high (sometimes 50 or 100). This means investors expect massive growth.
- The Strategy: Compare a company’s P/E to its competitors. If a tech company has a P/E of 80 but its rivals are at 30, you are paying a huge premium for “hope.” At Lucky Frog, we look for “Quality at a Reasonable Price.”
2. EPS (Earnings Per Share): The “Truth” Metric
If the stock price is what you pay, the EPS is what the company actually earns for you. It is the company’s total profit divided by the number of shares available.
- Why It Matters: A rising stock price is great, but a rising EPS is better. It proves the company is actually growing its bottom line, not just riding a wave of social media hype.
- The 2026 Trend: Look for “EPS Growth” over the last 3 to 5 years. A company that consistently increases its earnings is a company that knows how to navigate the modern economy.
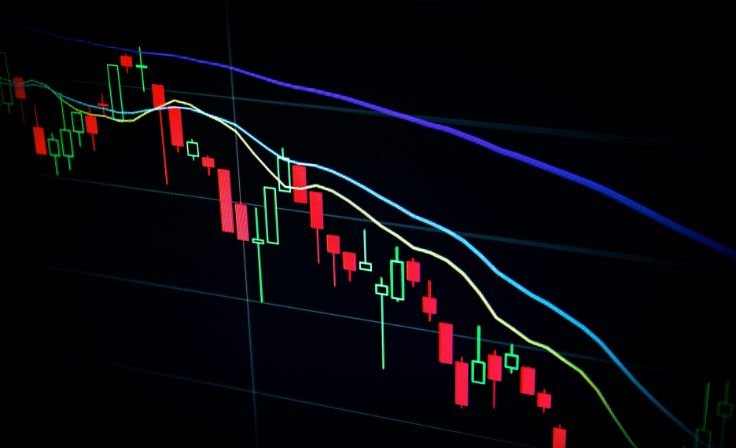
3. Volume: Is the “Story” Still Alive?
Volume tells you how many shares were traded in a single day. Think of it as the “heartbeat” of the stock.
- High Volume: Means there is a lot of conviction. Big institutional “whales” (like pension funds and banks) are moving in or out.
- Low Volume: The stock is “quiet.” If you buy a low-volume stock, it might be hard to sell it later without moving the price.
- The Red Flag: If a stock price is skyrocketing but the Volume is very low, the move might be fake—a “pump” that won’t last.
4. The “Beyond”: 2026’s New Vital Signs
In 2026, we look at more than just the basics. To truly understand a modern company, keep an eye on these two:
- Market Cap (Market Capitalization): The total value of the company. Is it a “Micro-cap” (high risk, high reward) or a “Mega-cap” (stable giant)?
- Dividend Yield: Some companies pay you just for owning them. If a stock has a 3% yield, they are sending you cash every quarter. This is the ultimate “Passive Income” for the Lucky Frog community.
The Lucky Frog “Data Dive” Checklist
Before you click “Buy,” ask yourself:
- Is the P/E higher than the industry average? (If yes, why? Is the growth guaranteed?)
- Has the EPS grown in the last 4 quarters?
- Is the daily Volume high enough that I can sell easily if I need to?
Final Thought: Analysis Beats Luck
The market is a machine that transfers money from the “Active” (who gamble on feelings) to the “Patient” (who analyze the data). By learning to read these reports today, you are moving from being a spectator to being a professional.
Don’t just watch the price. Understand the value.